

GRE data interpretation is not like regular data interpretation. To be successful in this section, you need to have special skills. If you’re just beginning your GRE prep, you need to know how important this section is, and how you can increase your GRE math score by turning this section into your strength. 💪
Data Interpretation may not seem like the most prominent question type on the GRE, but on test day, you can be sure to see at least 6 questions from this concept out of a total of 40 question in the GRE Quant section. That’s 15% of the entire math section – which should tell you how important this section is if you want to succeed in quant. 👈
What is Data Interpretation?
Data interpretation is simply the ability to interpret, or in other words, to visualize data and make sense of the information given.
On the GRE, you’ll get just one set of Data Interpretation questions per section. Each set contains one information source and three questions that follow it. This GRE Data Interpretation set will present data, information, in some graphical form, and it typically has three questions about the same data. So, you will see about 3 DI questions on each GRE Quant section.
Usually, DI questions require more time to solve, compared to the other questions in math. ⏲️
But the good thing about DI is that while you need to have some knowledge about a topic when you’re solving questions in quant, in case of GRE data interpretation, you do not need to know anything other than extracting data from the visual, and applying them to the questions given to you.
Why are data interpretation questions important on the GRE?
Data Interpretation is a vital part of the quant section on the GRE, because it measures your ability to visualize, understand, and extrapolate complex data, a skill that is necessary to succeed in grad school, where you’ll come across complicated information and data, especially in the STEM fields.
Data Interpretation, if done right, is an excellent way of presenting information succinctly, saving hundreds of words to describe something. ✌️
Graphs help you learn more information in a short time.
A graph is certainly worth a thousand words because when you see a graph, you will be able to understand what’s going on, without having to read any descriptive explanations. Graphs, therefore, help you learn more information in a shorter time period.
And that is why the GRE loves to test your interpretation skills. Now, if you are not technically sound, or if you are not someone with a strong math background, data interpretation may seem like a daunting task, at least in the beginning. In such cases, it would be helpful to start preparing for this section well in advance, by studying various types of graphs & charts on the internet, in newspapers, scientific journals, international new, etc. If you can spend time studying graphs on a daily basis, it would help you on the GRE.
Having said all that, solving GRE Data Interpretation questions is not so difficult either. If you are aware of the basic concept and the strategies needed to tackle specific questions on the test, then you should be in a safe spot.
Types of GRE Data Interpretation Questions
Before you understand how to answer the data interpretation questions, you should know what you’re getting into. On the GRE Data Interpretation questions come in more than one form. Hence, it would be ideal to learn them all so you will be familiar with them on test day, and therefore approach the questions with confidence.
Here are the different types of data that you’ll see on the GRE. 📊
1. Data Interpretation – Pie Chart
Pie charts are the most popular type of data on the GRE.
A pie chart is also called a circle graph because it is a circular chart divided into sectors. The sectors illustrate percentages or proportions of a quantity that is defined in the question itself. Every pie chart is divided into multiple ‘pies’ or sectors, each of which represents a certain quantity.
Pie charts are the most popular type of data.
The beauty of a pie chart is that it helps you understand information very easily. 👍
For example, take a look at this pie chart that illustrates browser penetration among internet users across Europe. So, anyone who looks at this graph can say without hesitation that Firefox is the most popular browser of all and that Opera is the least popular.
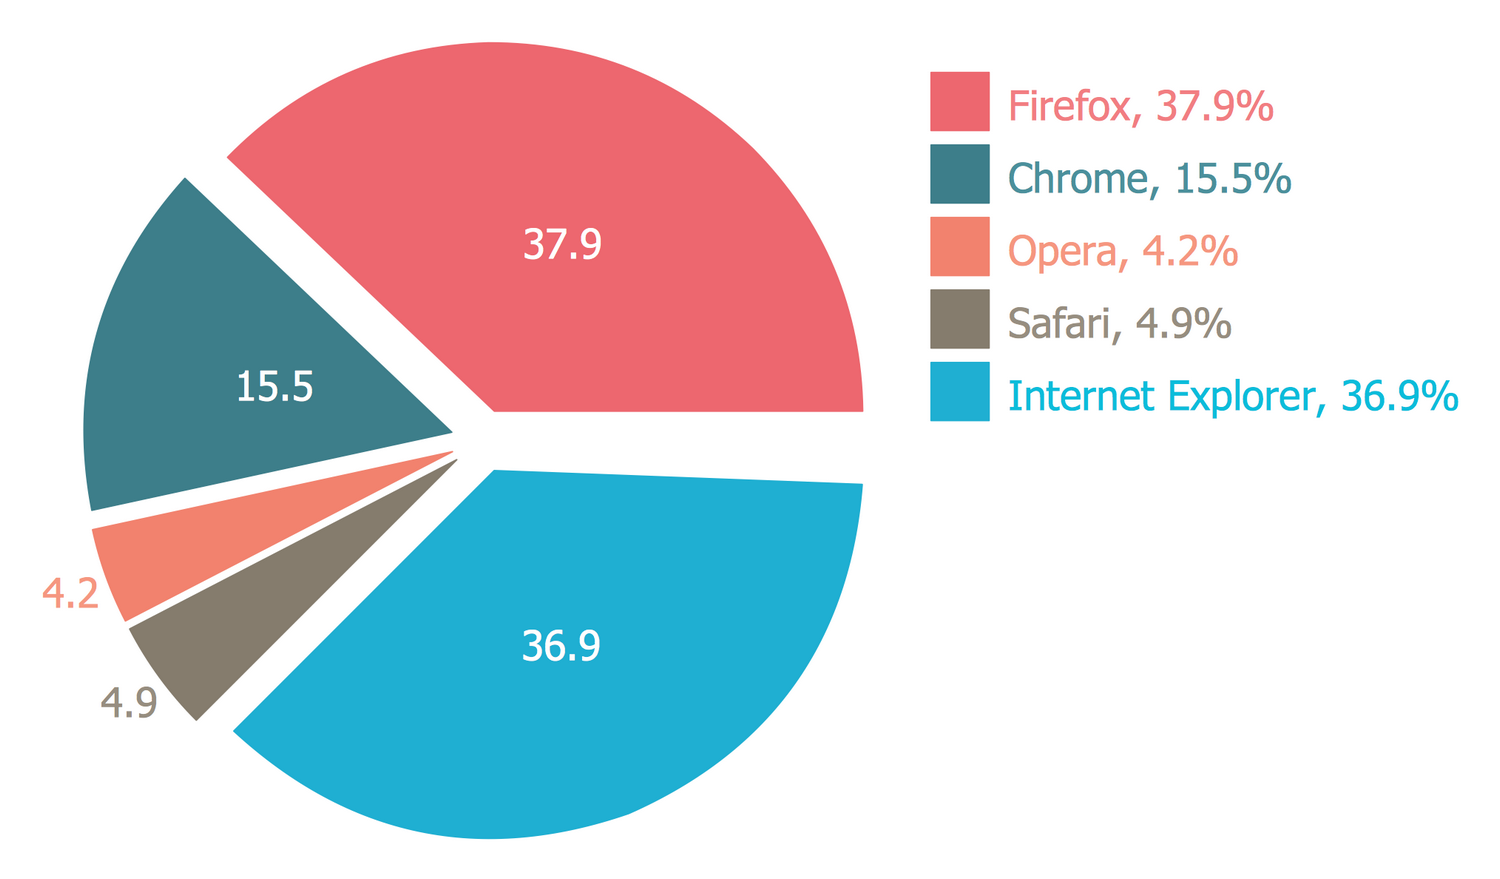
But it doesn’t end just there. You can use this information to answer any question thrown at you. For instance, if the question asks you to find the number of Chrome users given that total number of users is 1 million, then you can simply use your knowledge of percentages, and say that the number of Chrome users is 15.5% of 1,000,000 = 155,000.
2. Data Interpretation – Column Chart
Column charts are the second most important type of illustration on the GRE. They are also known as bar charts by some, and on the GRE, they may be referred to as either.
A bar chart is a kind of visual illustration that has rectangular bars with lengths proportional to the values they represent. The bars can be plotted vertically or horizontally.
Height of bars is proportional to their value.
So think of bars as skyscrapers or really tall buildings in a city. The height or the length of these bars is proportional to the value they represent, meaning their length increases 🔼 if there is an increase in the value they represent, and decreases 🔽 if the value decreases.
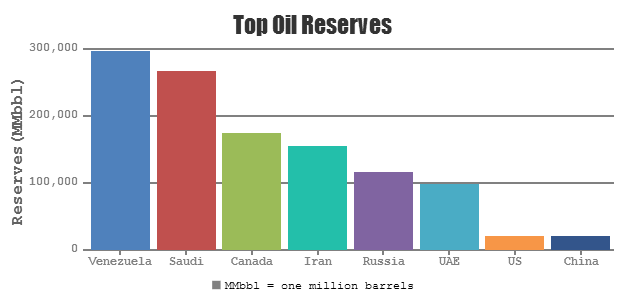
For instance, in this graph, you can see how a bunch of countries compare when it comes to a number of oil reserves they hold. Anyone can tell by looking that this graph that Venezuela has the largest oil reserve in the world.
But with the help of the information given here along with the bars or columns, you can also quantify the differences between countries. For instance, given that Venezuela has 300,000 million barrels of oil, and that Iran has 150,000 million barrels, you can say that Venezuela has twice as much oil as Iran, or that the ratio of their oil reserves is 2:1.
You may even be asked questions related to ratios, proportions, and percentages.
3. Data Interpretation – Line Chart
You may be familiar with line charts already. Line charts are usually shown on TV to compare the progress of two quantities. For example, the GDP growth rates of two countries over time, or the performance of two stocks in the last quarter, and so on.
So what is a line graph? And what does it represent?
A line graph displays information as a series of data points connected by straight line segments. Line graphs help you understand the movement or growth Here is an example of a line graph illustration.
Line graphs display the movement or growth of quantities.
Here is an example of a line graph

With such graphs, you will be asked questions like which year saw the maximum percentage change in share of voters for the Democratic party, or the average percentage share of the voters for the Republican party from 1980 to 2010.
You will be able to answer such questions easily if you are able to identify the data points correctly from the given line graphs. 👌
4. Data Interpretation – Box and Scatter Plots
Scatter plots are rarely seen on the GRE, compared to the other types of graphs that we discussed in this chapter so far. But then they’re also a bit more difficult compared to the rest of the GRE data interpretation graphs.
Scatter plots are useful to display bivariate data.
A scatter plot is a way of displaying bivariate data, that is, measures of two different variables for each subject. In other words, a scatter plot is a visualization of the relationship between two variables measured on the same set of individuals, for instance: age and weight of several persons on the same graph, or their annual income and the amount of debt they carry, or their number of kids and number of cars, and so on.
For instance, a scatter plot may be used to show the number of hours studied by students In a university and the corresponding score in GRE Quant.
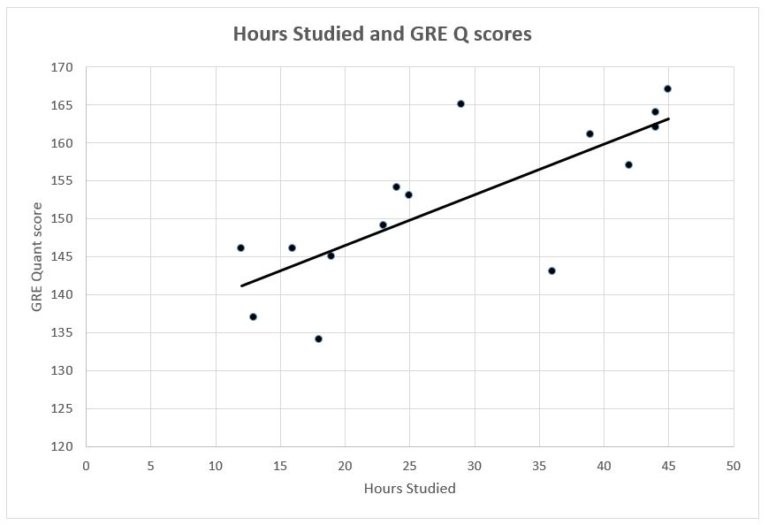
Using this graph, it is easy to answer any questions related to the information provided here.
For example, you may be asked the highest score in GRE quant among those who studied less than 30 hours.
So, those are the various types of data that you’ll see on the GRE exam. Now, questions on the GRE may not be this simple, but nevertheless, the manner in which data is presented will resemble what you just saw here. But, it also should be noted that this is just a bird’s eye view of each question type, and you can learn more about each of these in our lessons. 👈
GRE Math: Data Interpretation tips and strategies to ace the quant section
Now that you are aware of all the different types of GRE data interpretation questions that you’ll see on the exam, it is important that you also understand how you can solve them.
Here is a comprehensive list of DI tips and strategies that you need to employ so you can answer every data interpretation question correctly every time, and also get to the answer quickly. ✔️
Strategy #1: Read the question stem before looking at the questions
Unlike most other questions in the quant section, GRE data interpretation questions involve a lot of visual information which can sometimes be confusing or misleading if not read properly. A lot of students make the mistake of going straight to the questions without even looking at the figures given in the question stem. 🚫
The problem with this approach is that when you look at the question first, you’ll have to go through the visuals every time you read a new question. That means, you’re spending unnecessary time on something that you can avoid altogether.
Don’t lose sight of the big picture.
In addition to that, because you’re looking at the visuals or data after reading a particular question, there’s a chance that you’ll have a narrow perspective on the visual, and on the overall information provided by the visual, so you’ll lose sight of the big picture.
And when it comes to data interpretation, the big picture is certainly important. So, always make sense of the given data first, and only then move on to the first question. It may seem like you’re spending more time on the data than necessary, but the trick is that you only have to do it once, and then you’re off to the questions.
This approach saves you a ton of time over the course of a few questions. Besides, while it may seem difficult to answer questions in time in the very beginning, you’ll soon get used to the approach as you keep practicing more questions.
Strategy #2: Examine the graphs and data very carefully
Continuing with the previous strategy, you should make sure you understand what the information provided in the question represents.
In order to be able to answer correctly every question that follows the given data, it is important that you know what information the chart, graph or table is providing, what the parameters are, what quantities are being represented, and what units of measurement are being used.
It is easy to get confused with simple things like these, so always watch out for these bits of information in a GRE data interpretation question. After all, the GRE test makers try to confuse you wherever they can or trick you into falling for trap answer choices. 🤕
Notice what the x and y axes represent.
One of the basic mistakes that test takers make is to not notice the axes in the graphs given in the question step. You must always carefully examine what the x-axis and the y-axis represent, because the quantities or units that they represent are important to understand the context of the question.
Sometimes the questions may be twisted when it comes to the units of measurement, which means you’ll need to convert the units into what’s required by the question. And to do that, you should understand what units are used in the given data.
Strategy #3: Always take notes
If we haven’t said it loud enough already on this blog, 🔊 let me say it again – never underestimate the power of taking notes on the GRE exam. Note taking is the one habit that is pretty common among students who get the highest scores on the GRE every year, and if you would like to join that club, then you too should take notes.
Never underestimate the power of note taking.
Never try to understand or solve a GRE data interpretation question without writing down the figures and numbers. There’s a significant difference between viewing the same numbers on the screen and trying to figure out the information given, and writing them on your scratch paper so you can make sense of it all easily.
Although this process may take a few more seconds, it’s a great bargain at the end of the day, because the chances of getting the answer right shoot up if you take down notes and write out the all the math.
Strategy #4: Look for patterns within the given data
Pattern recognition is an approach that is not usually implemented on GRE data interpretation questions, but it definitely comes in handy when you are unable to understand the given information, or if you’re confused with the numbers.
Patterns can help you understand complex information.
In some cases, when there’s a wealth of information and multiple figures given in the same question stem, the numbers and figures can put you in a spot of bother. If that happens, you can look for patterns 🔍 in the given information, and ask yourself simple questions such as: “Is there any correlation between the different pieces of data shown here?”, “Is the correlation direct or indirect?” or “Are there any limits or conditions to these values?”, and so on.
Doing this will help you get specific answers and hence remove the confusion. But even if you are good with numbers, and are able to glean the information without trouble, you could still search for a pattern just to be sure.
Strategy #5: Learn to approximate values
It is quite rare to find perfect values and percentages on the GRE exam. If you have solved enough practice questions already, you might have seen some pretty uncomfortable numbers among the questions. 😕
ETS likes to make you feel uneasy, and that is why you’ll see numbers like 29% instead of 30%, or 8/9 instead of 1, or $352,000 instead of $350,000. While this might seem frustrating to the novice test taker, it often needs one simple technique to make it all easy; to make these numbers work for you without you having to sweat it out.
And that technique is ‘approximation’. If you think about it, there’s not much of a difference between 29% and 30%, and as such, you can easily replace those two numbers. For instance, if the questions says 29% of 98000 students have written a test, then you can simply rewrite it as 30% of 100,000 students, which is 30,000 students.
Approximation can get you correct answers while saving time.
While it may not be the most accurate method to solve the given question, you can still get away with approximation, because it can get you the answer very quickly, saving you a ton of time.
Moreover, you can match your answer with the number in the answer choice by looking at how close they are to each other. What most students do when they see numbers like these is they either get too worked up or resort to using the calculator, neither of which are desirable outcomes.
Instead of seeking refuge with the on-screen calculator, or worrying about how twisted the numbers are, you could simply round them all off, do the calculation like it’s a walk in the park, and then compare your answer with the given answer choices so you can select the one that matches best.
Strategy #6: Be careful with percentages on GRE Data Interpretation questions
When answering data interpretation questions on the GRE, you should always be careful to not confuse percentages with the actual total.
Almost every visual or information given along with Data Interpretation question stems will involve percentages, and there’s a great chance of you getting it all mixed up. 😓
Don’t confuse percentages with actual values.
For example, if the question says that Company A has increased its revenue by 50% from 2011 to 2017 and that the revenues of Company B has decreased by 30% during the same time period, then the natural tendency is to jump to the conclusion that the revenue of Company A is greater than that of Company B in the year 2017.
But this is where most students go wrong. It is worth noting that without knowing the total revenues of these two companies, we simply cannot say which company has greater revenue in any year.
So, always pay attention to the minute details, and make sure you’re not assuming something that is not explicitly stated in the question.
Strategy #7: Learn the shortcuts
On the GRE, you don’t have the luxury of taking as much time as you want to solve a question. And because time is limited on the exam, you will sometimes need to use shortcuts and formulae in order to solve data interpretation questions.
Use shortcuts and formulae to answer faster.
Remember that Data Interpretation questions on the GRE also include several other topics in math, such as percentages, ratios, fractions, and basic mathematical operations. So, the more shortcuts you know for these topics, the faster you can answer data interpretation questions on the GRE. 🚗 💨
For instance, knowing that tripling the value of a variable is equivalent to an increase of 200 percent over the original value, or that 96% of 25 is approximately equal to one-fourth of 24, etc., will help you answer questions faster. If you’re looking to answer all 6 GRE data interpretation questions correctly, then the ability to approximate values is a crucial skill that you need to master.
Now It’s Your Turn
So those are the various types of questions you will see in GRE Data Interpretation, along with the various strategies that you can employ in order to be able to answer any Data Interpretation question on the GRE.
If you have already studied for the GRE, and did well in Data Interpretation, then let us know if you have any tips that worked out really well for you. We’ll add them to this guide and share it with everyone. 📢
But if you’re still studying for the GRE, and you need help with your prep, then we at CrunchPrep are here to answer any questions you may have. We’ve helped hundreds of our students score 170 In the quant section, and we can help you get the top score as well. Reach out to us if you would like us to assist you with your GRE prep. 🙂